In this data analysis and visualization project, using the DataSet made available by the Ministry of Infrastructure and Transport , 4 graphs will be created on the problem of worker strikes transport in Italy, in particular:
• A histogram on the number of transport strikes from 2014 to 2020
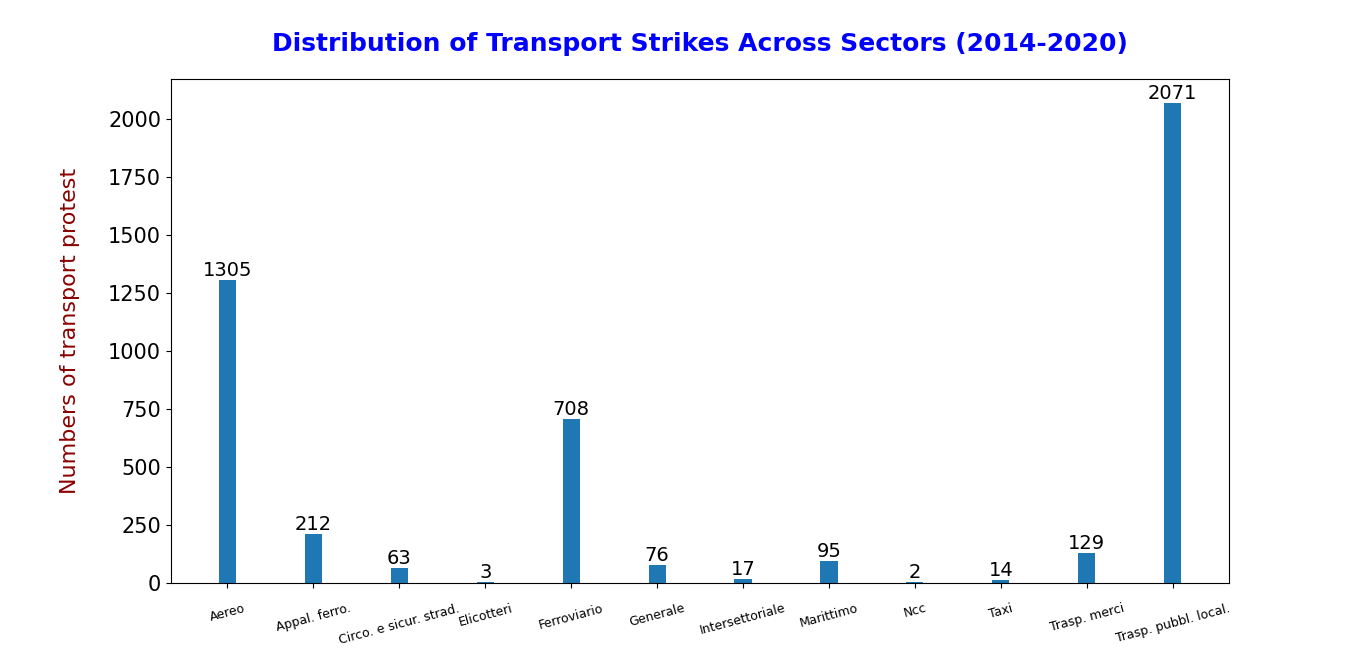
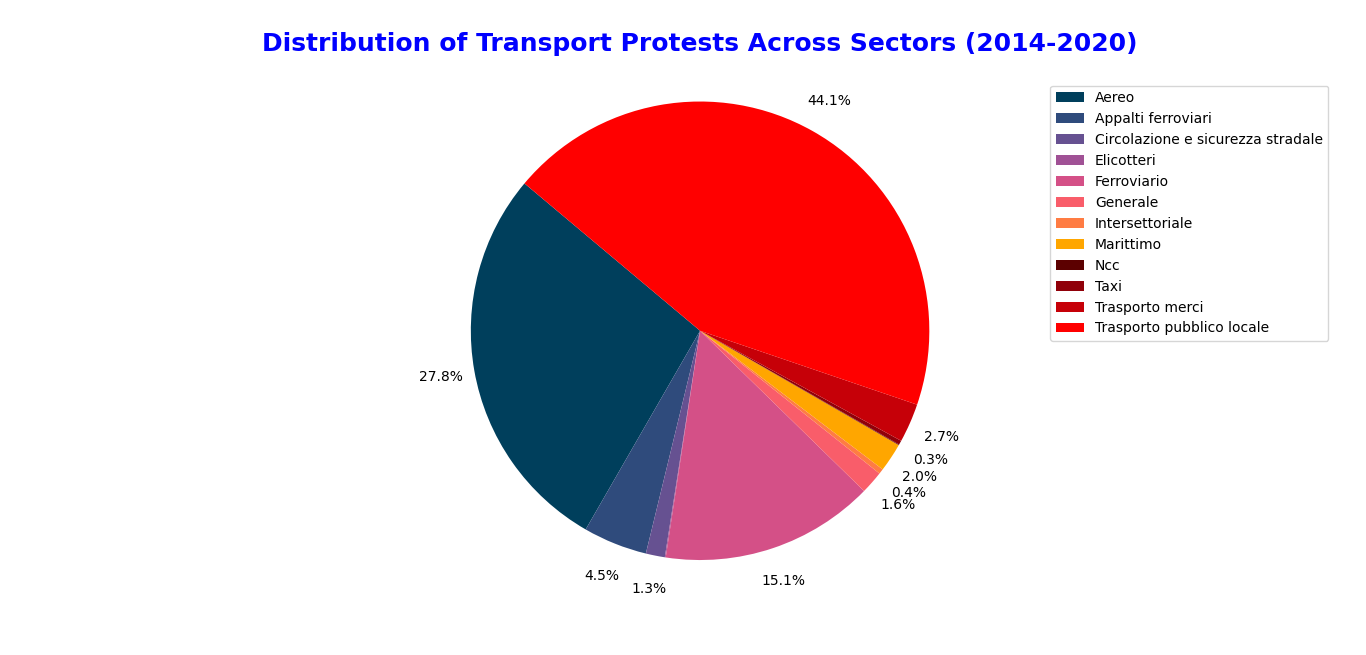
• A bar chart and pie chart on the number of sectors where strikes occurred
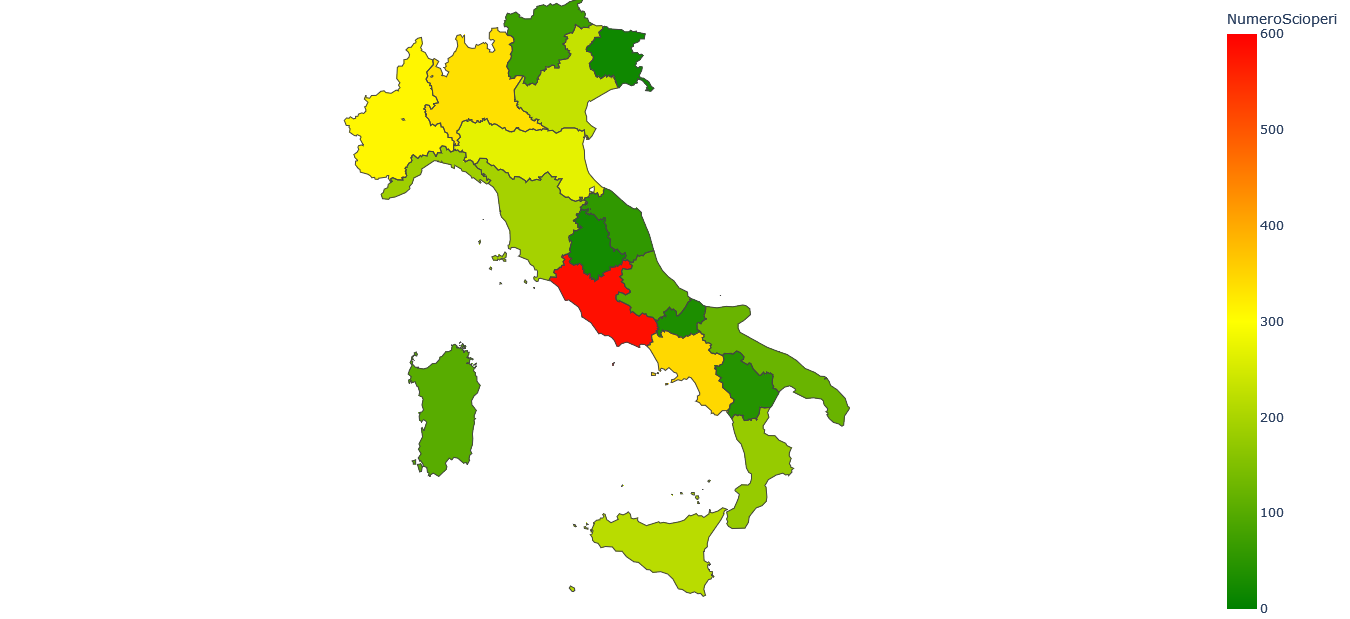
• Visualization of a choropleth map on the number of strikes in Italy by region