This project use the dataset taken from the Open Data of Sicily. This dataset needs to create histograms
Technologies used in this project:
- Python - Pandas - Matplotlib - Plotly
Choropleth Maps:
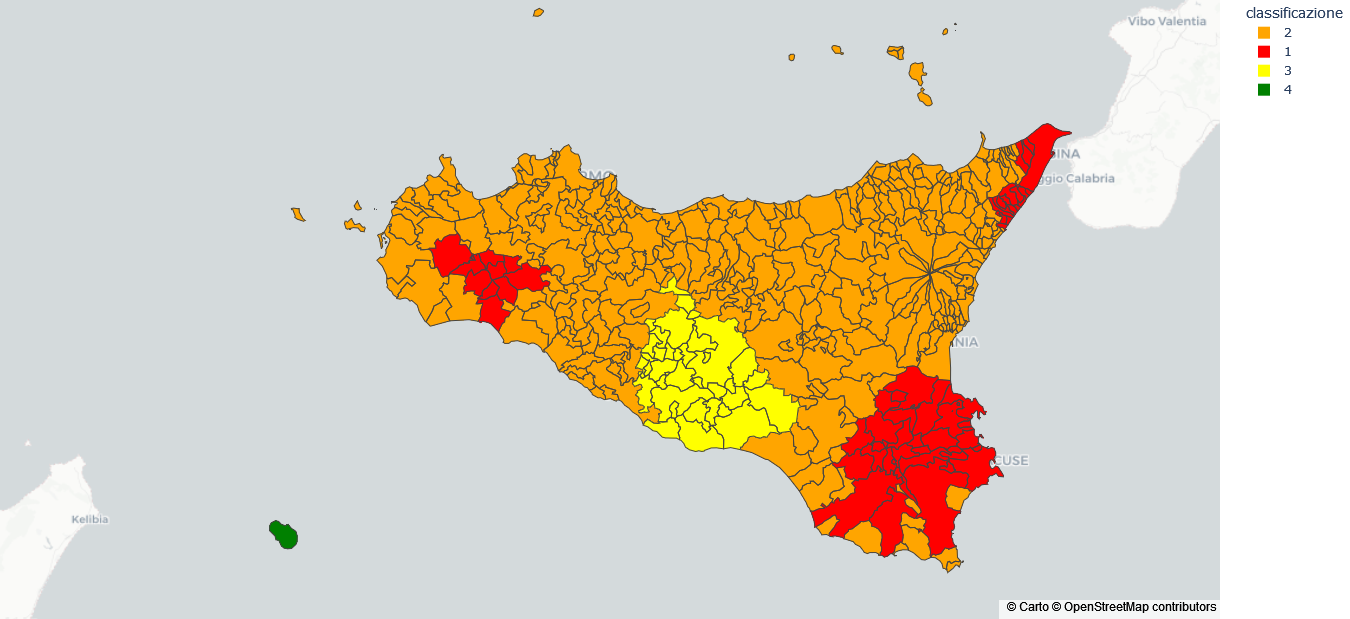
1. Choropleth map with the level of sismicity
This python file create the choropleth maps of the Sicily with the 4 level of seismicity. This script use the geoJSON file taken
from here.
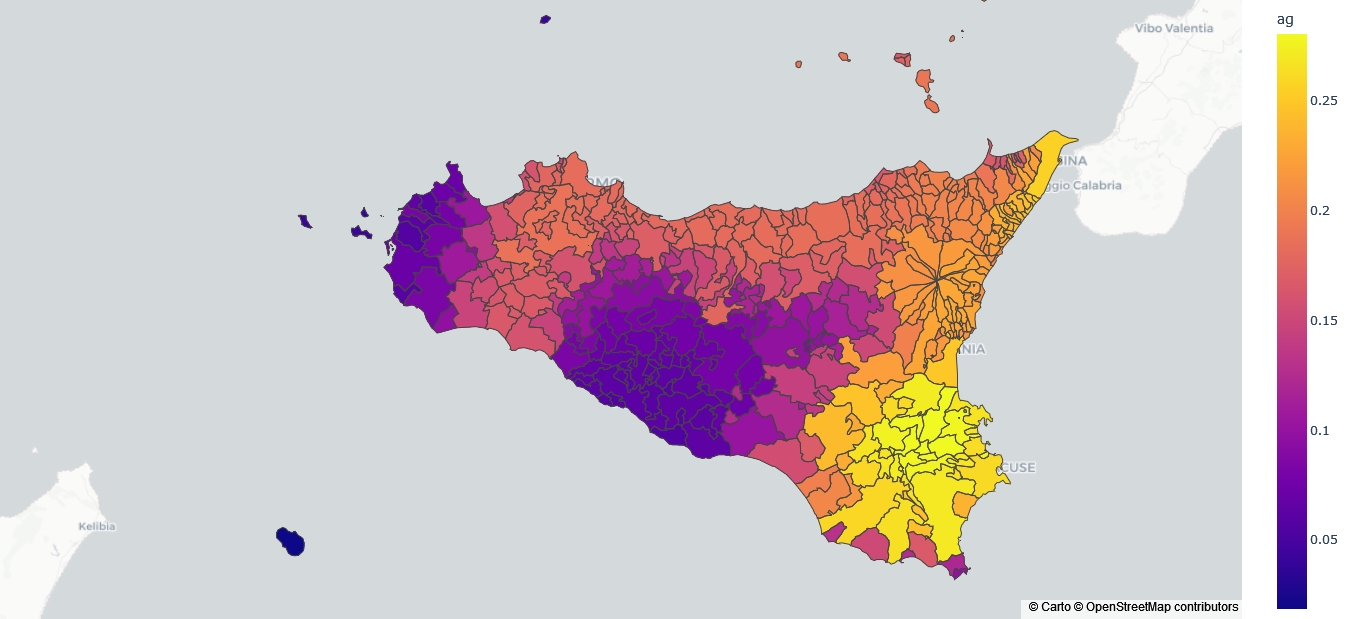
2. Choropleth map with the level of sismicity
This python file create the choropleth maps of the Sicily with the ag value (accelerazione massima su suolo rigido, i.e. maximum acceleration on hard ground) of seismicity.